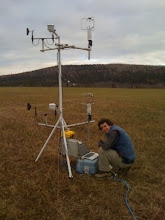
In our last field study we characterized the N2O5 loss to the snow pack (Fall 2009). Now we are setting up on the roof to study the loss of N2O5 on atmospheric particles. This way we can partition the total loss of N2O5 from the snow pack and the atmosphere at high latitudes. In this picture Patrick is getting ready to install the main inlet that will measure the N2O5, NOx and Ozone.

The final set up with the meteorological tower and the inlet.

In addition to the meteorological instruments we have also installed a Vaisala FS 11 visibility monitor. This instrument reports the visibility in kilometers in the atmosphere. The visibilty is related to particles in the atmosphere.

The sunset on the roof and getting read to start the field study.
 In our last field study we characterized the N2O5 loss to the snow pack (Fall 2009). Now we are setting up on the roof to study the loss of N2O5 on atmospheric particles. This way we can partition the total loss of N2O5 from the snow pack and the atmosphere at high latitudes. In this picture Patrick is getting ready to install the main inlet that will measure the N2O5, NOx and Ozone.
 The final set up with the meteorological tower and the inlet.
 In addition to the meteorological instruments we have also installed a Vaisala FS 11 visibility monitor. This instrument reports the visibility in kilometers in the atmosphere. The visibilty is related to particles in the atmosphere.
 The sunset on the roof and getting read to start the field study.